NIFTY 50 – Daily Technical Analysis
Current Price: 23,450 | Change: +127 (+0.54%)
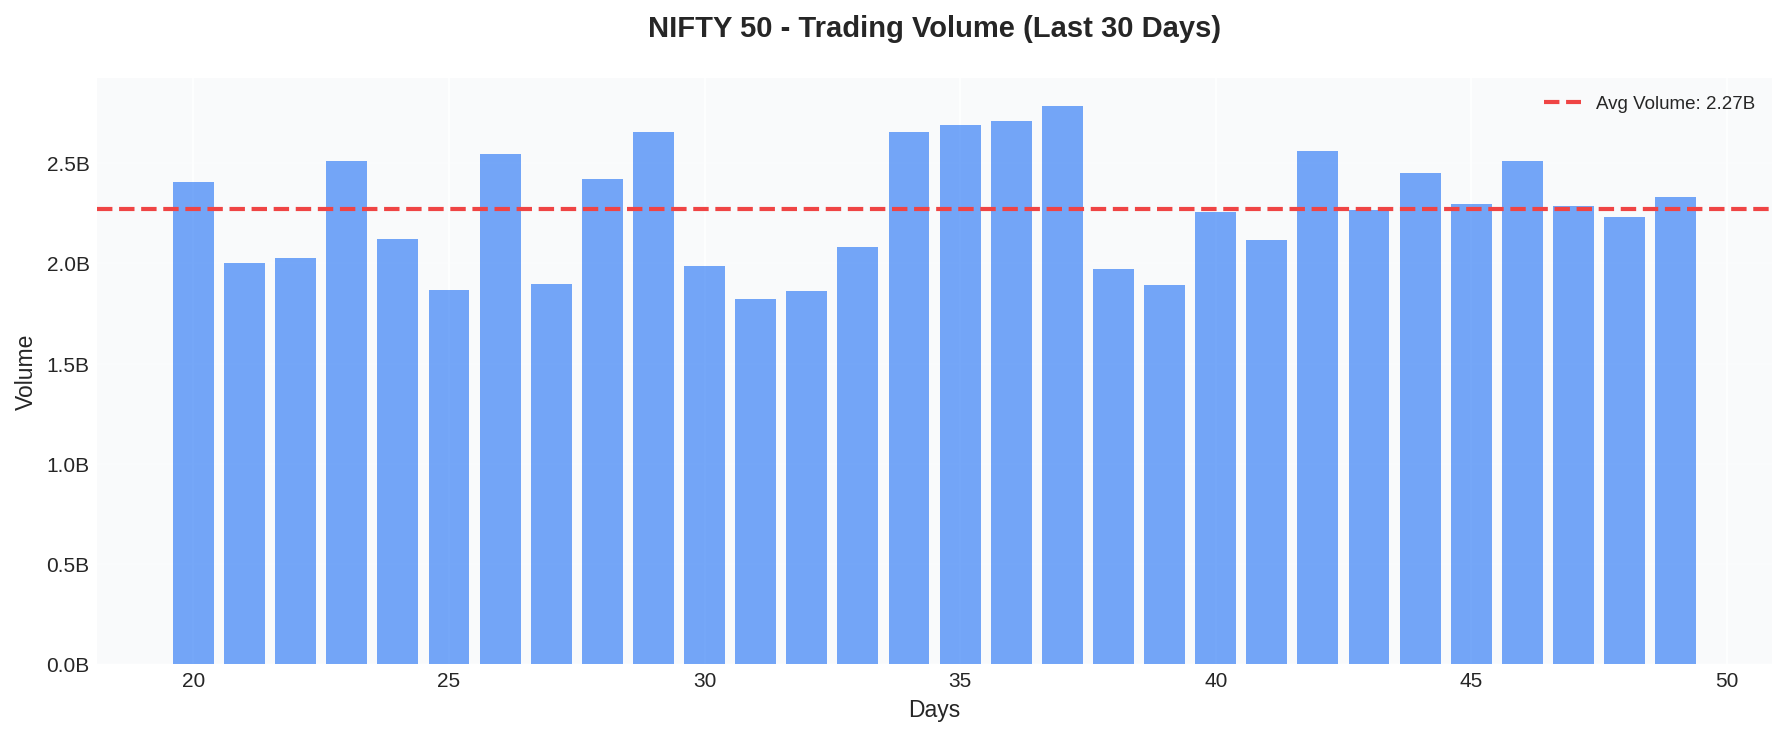
52W High: 24,550 | 52W Low: 20,850 | Volume: 2.45B | P/E: 21.5
📊 Technical Charts
🎯 Support & Resistance Levels
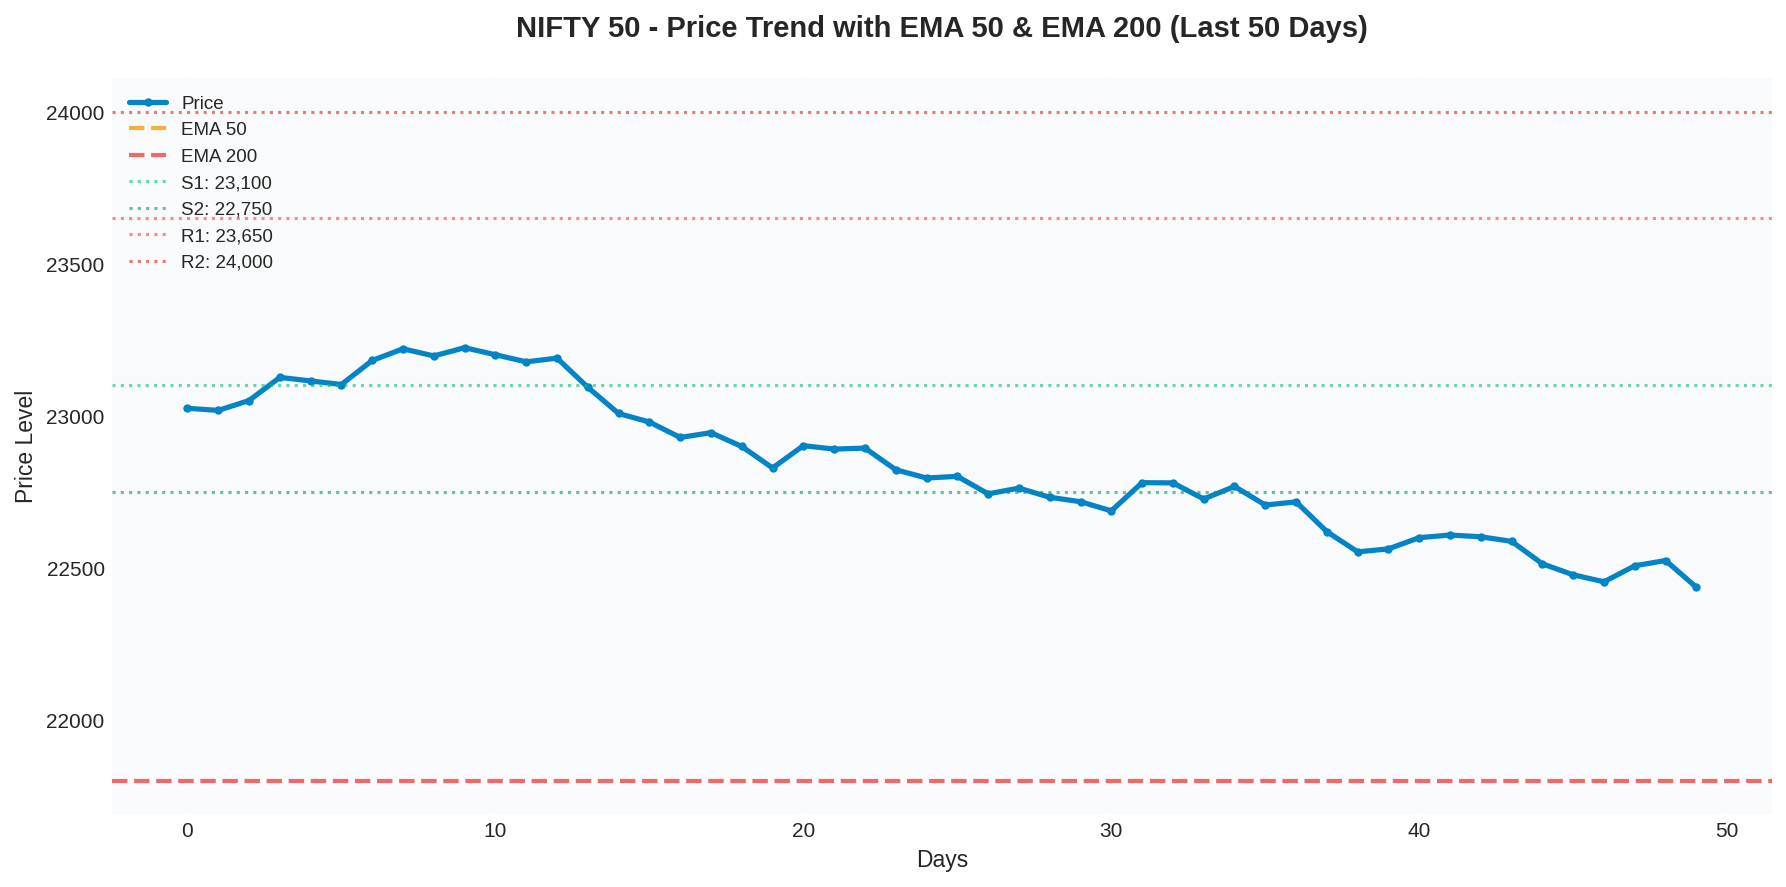
Strong Support (S2): 22,750
Critical support level. Strong buying interest expected if index tests this level. Key long-term support from previous consolidation zones.
Immediate Support (S1): 23,100
First support level. Minor pullback zone. Consolidation likely if broken. Significant selling volume expected around this level.
Immediate Resistance (R1): 23,650
Near-term profit-taking zone. Breakout above this with volume could lead to fresh highs. Watch for resistance breakout confirmation.
Strong Resistance (R2): 24,000
Major resistance level. Breakout above this opens path to 24,500 and higher. Requires strong volume and positive sentiment.
📈 Trend Analysis
Short-Term Trend (1-5 Days): Mixed with consolidation. Index is holding around 23,400 after recent gains. EMA 50 providing support. Minor resistance at 23,650.
Intermediate Trend (5-21 Days): Uptrend intact with temporary pullback phase. EMA 50 above EMA 200 confirms bullish momentum. Support levels: 23,100 and 22,750 acting as strong buying zones.
Long-Term Trend (21+ Days): Uptrend in place with higher highs and higher lows. Wide trading range: 20,500 to 24,500. Break above 24,000 could signal stronger uptrend continuation to 24,500+.
Moving Average Alignment: EMA 50 (23,200) above EMA 200 (21,800) = Bullish setup. Price above both moving averages indicates strong buying pressure. Golden cross formation maintaining upside bias.
🚀 Breakout Scenarios & Targets
Bull Case (Bullish Breakout) – 65% Probability
- Breakout Trigger: Close above 23,650
- Target 1: 24,000 (+2.35% from current)
- Target 2: 24,350 (+3.84% from current)
- Target 3: 24,750 (+5.55% from current)
- Stop Loss: 22,850
Bear Case (Bearish Breakdown) – 35% Probability
- Breakdown Trigger: Close below 23,100
- Target 1: 22,750 (-2.98% from current)
- Target 2: 22,300 (-4.91% from current)
- Target 3: 21,800 (-7.03% from current)
- Stop Loss: 24,000
📰 Key News & Market Events
- HIGH IMPACT: US Fed Interest Rate Decision expected next week. Market pricing in potential rate pause amid inflation concerns.
- HIGH IMPACT: Q2 FY26 Results season begins next week. Major IT and Banking companies to announce earnings (TCS, Infosys, HDFC Bank).
- MEDIUM IMPACT: Crude oil prices stable around $103/barrel. Positive for downstream sectors, negative for upstream energy.
- MEDIUM IMPACT: INR trading at 95.86 per USD. Weak rupee headwind for IT and Pharma exporters despite benefit to FII inflows.
📊 Weekly Outlook: BULLISH
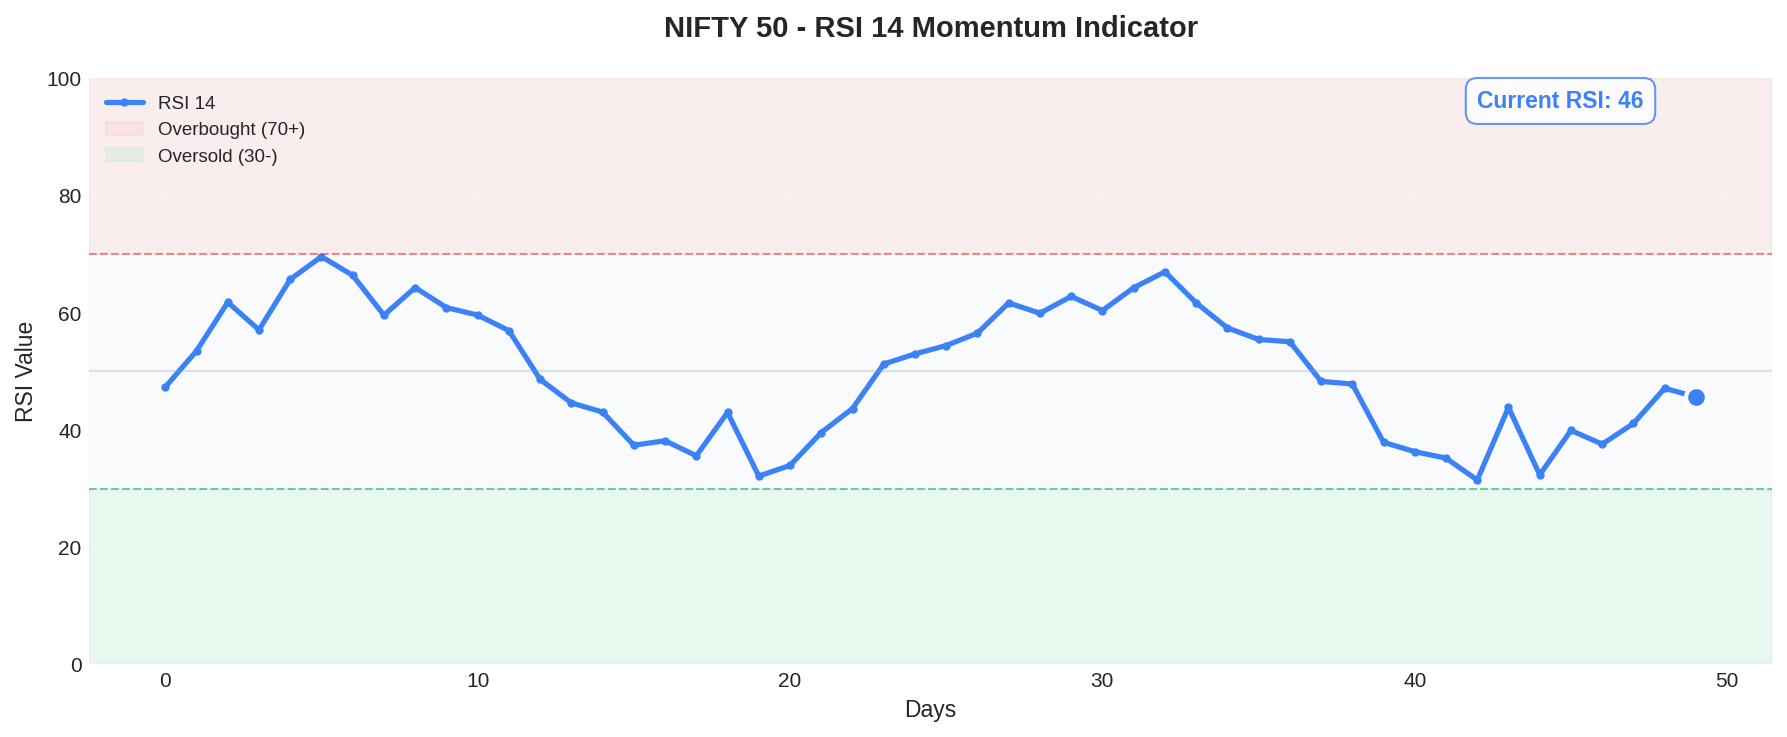
The NIFTY 50 is maintaining bullish momentum with the index trading above both EMA 50 and EMA 200. The pullback seen in recent sessions appears to be a healthy consolidation within an uptrend. Breakout above 23,650 with strong volume could trigger a rally towards 24,350-24,750 targets. Support holds strongly at 23,100 with critical support at 22,750. Upcoming earnings season could provide fresh catalysts. Traders should watch for global cues, especially Fed commentary next week. RSI at 62 suggests room for upside without overbought conditions yet.
Key Watch Points:
- Break and hold above 23,650 for bull confirmation
- Support test at 23,100 – buying opportunity if held
- Volume confirmation on any breakout moves
- Fed announcement impact on FII flows
- IT sector performance on Q2 earnings announcements
Disclaimer: This analysis is for educational and informational purposes only. It is not financial advice and should not be considered as a recommendation to buy or sell any security. Past performance does not guarantee future results. All investments carry risk, including potential loss of principal. Please consult a qualified financial advisor before making investment decisions.


Leave a comment